Are you tired of manually calculating totals for large sets of data in Excel? Fortunately, Excel offers a Total Row feature that can save you significant time and effort. In this detailed guide, we will walk you through the step-by-step process of adding a Total Row to your Excel sheet. We will also explore tips for customization, troubleshooting common issues, and provide best practices for working with large data sets.
Step-by-Step Guide: Adding a Total Row in Excel
The Total Row feature in Excel is a powerful tool for data analysis and organization. Here’s how to use it effectively:
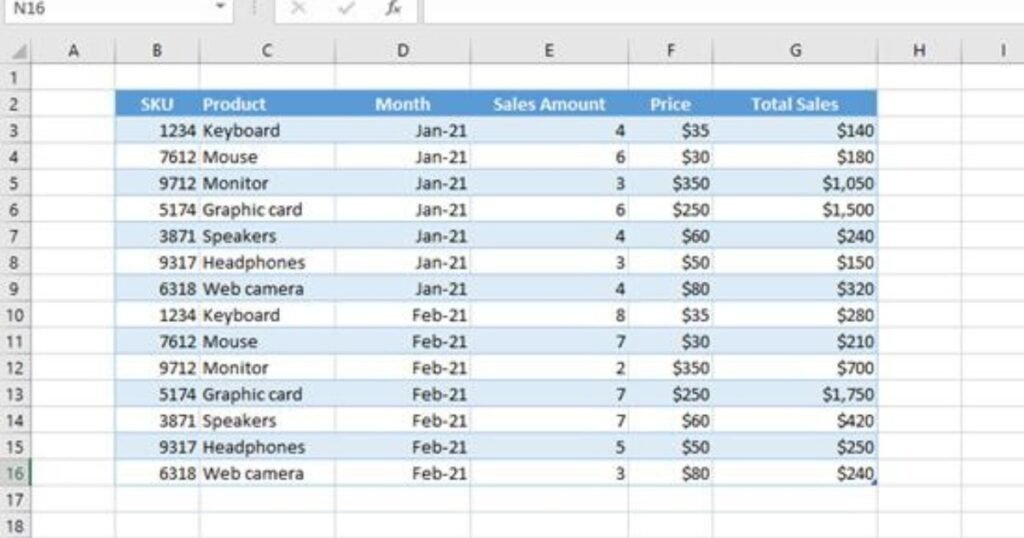
Select Your Data Set:
- Start by selecting the entire data set that you want to add a Total Row for.
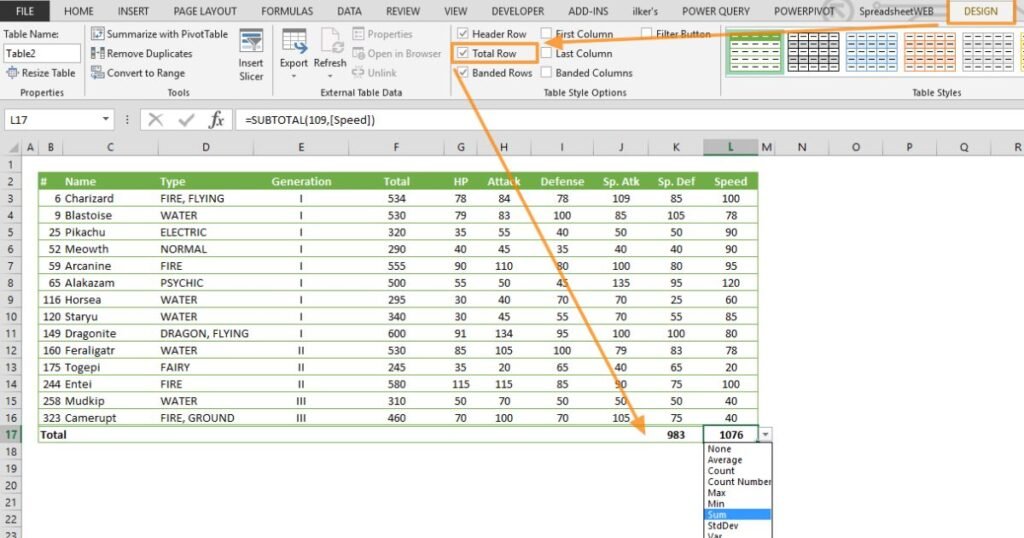
Access the Total Row Feature:
- Navigate to the “Table Tools” tab in the top toolbar.
- Select “Total Row” from the options provided. A new row labeled “Total” will be added to your table.
Customize Functions (if needed):
- By default, Excel calculates the sum of all numeric columns in your data set.
- You can customize the function used for each column by clicking the dropdown arrow in the Total Row cell and selecting your desired function.
Ensure You Have Headers:
- The Total Row feature only works with tables that have headers. If your data set lacks headers, you’ll need to add them.
- Select the top row of your data set, right-click, and choose “Insert” > “Table Rows Above” to add a new row for your headers.
Utilize Filtering:
- The Total Row also enables you to filter your data by specific criteria. Click on the dropdown arrow in the Total Row cell and select “Filter” to choose criteria for filtering, like a specific date range or a particular value in a column.
Understanding the Benefits of Using the Total Row Feature in Excel

The Total Row feature in Excel offers several advantages:
Time and Effort Saving:
- Instead of manually calculating totals and other functions, the Total Row feature automates the process, saving you time and effort.
Data Analysis and Trends:
- It helps identify trends and patterns within your data by calculating averages, minimums, maximums, and other functions.
Customization:
- You can choose which functions to use, format the Total Row to stand out, and tailor it to your specific data and analysis needs.
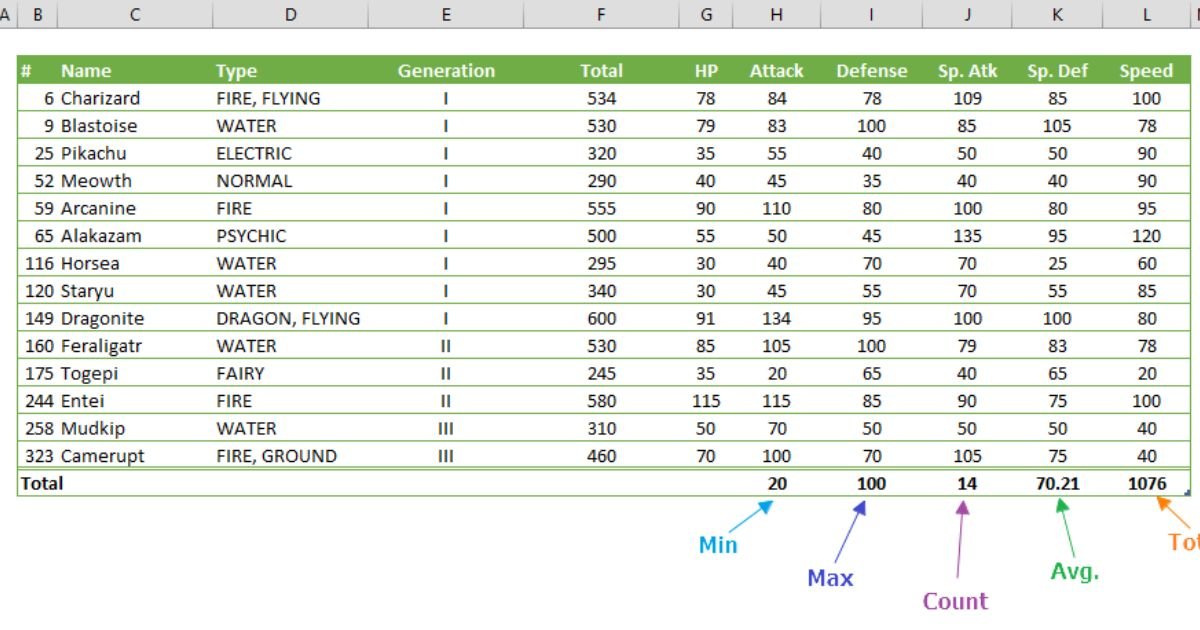
How to Use the Total Row Feature to Calculate Various Functions in Excel
Excel’s Total Row feature can calculate a variety of functions beyond the standard sum. Here are some common functions you can use:
Average:
- Calculates the average of all values in a column.
Count:
- Determines the number of non-blank cells in a column.
Max:
- Finds the maximum value in a column.
Min:
- Finds the minimum value in a column.
Product:
- Multiplies all values in a column to find the product.
To use these functions in your Total Row, click the dropdown arrow in the cell and select your preferred function. You can also manually enter a function by typing “=FUNCTION.”
Customization:
- Customize each column’s calculation by selecting the desired function from the dropdown menu.
Ensure your data is structured with headers, and consistent throughout the column for the Total Row to function correctly.
Customizing the Total Row Feature for Your Specific Data Needs
The Total Row feature is highly customizable to cater to your specific data requirements:
Change the Label:
- You can rename the Total Row by clicking on the cell and entering a new name.
Add Custom Rows:
- Incorporate additional rows below your Total Row for custom calculations.
Function Selection:
- Excel defaults to the SUM function for numeric columns, but you can change it to other functions like AVERAGE, MAX, MIN, or COUNT.
Subtotals:
- Generate subtotals for your data by selecting appropriate grouping options and functions.
Troubleshooting Common Issues When Adding a Total Row in Excel
Encounter problems while adding a Total Row? Here are common issues and their solutions:
Proper Excel Table:
- Ensure your data is formatted as an Excel table. Select your data and press “Ctrl+T” to convert it to a table.
Existing Total Row:
- Excel allows only one Total Row per table. Delete the current one if you want to add a new Total Row.
Data Errors:
- Check your data for errors, like non-numeric values in columns used for sum calculations.
Large Data Sets:
- Large data sets might lead to slow calculations or errors. Consider breaking them into smaller tables for better performance.
Software Issues:
- Restart Excel or update it to the latest version if you encounter persistent problems.
Best Practices for Using the Total Row Feature in Large Data Sets
When working with large data sets, follow these best practices:
Organize Your Tables:
- Label your data and columns effectively for easy reference.
Use Filters and Sorting:
- Filters and sorting help you quickly find and organize specific data within your table.
Consider Pivot Tables:
- Pivot tables offer a more dynamic and customizable way to analyze large data sets.
Ensure data consistency and accuracy before using the Total Row feature, and format your data consistently with the correct number of decimal places and units of measurement.
How to Add Conditional Formatting to Your Total Row in Excel
Conditional formatting can make your Total Row more visually informative. To add it:
Select the Cell:
- Choose the cell in the Total Row you want to format.
Access Conditional Formatting:
- Navigate to the “Conditional Formatting” dropdown in the top toolbar.
Choose a Formatting Option:
- Select from pre-set formatting options like “Color Scales” or “Data Bars.”
Create Custom Rules:
- To create custom formatting rules, choose “New Rule” and set your desired conditions.
Manage Rules:
- Edit or delete existing rules by selecting “Manage Rules” from the “Conditional Formatting” dropdown.
Tips and Tricks for Increasing Efficiency When Adding a Total Row in Excel
Boost your efficiency when using the Total Row feature with these tips and tricks:
Use Keyboard Shortcuts:
- Learn shortcuts like Alt+Down Arrow to access dropdown menus quickly.
Utilize Formulas:
- Manually type in formulas for custom calculations in your Total Row cells.
Copy and Paste:
- Copy and paste Total Rows to multiple data sets.
AutoSum Feature:
- Use the AutoSum feature to automatically calculate and add up values in a column. Click the cell where you want the sum, and then select the AutoSum button in the Home tab.
With these strategies in mind, you can seamlessly add Total Rows to your Excel tables, analyze your data more efficiently, and make informed decisions based on the results.
Also Read:
How Do You Remove Only Conditional Formatting In Excel?
How To Delete An Excel Spreadsheet?
Frequently Asked Questions (FAQs)
Can I use the Total Row feature in Excel without column headers?
- No, the Total Row feature requires headers for each column to function correctly. If your data lacks headers, add them before using the Total Row feature.
What should I do if Excel is slow when calculating the Total Row for a large data set?
- For large data sets, consider breaking them into smaller tables for better performance. This can help speed up calculations.
Can I use the Total Row feature for non-numeric data?
- The Total Row feature is designed for numeric data. If your data set contains non-numeric values in a column used for calculations, it may result in errors. Ensure your data is consistent and contains only numeric values.
How do I update or change the function used in a Total Row cell?
- To change the function used in a Total Row cell, click the cell, and either select your desired function from the dropdown menu or manually type in the formula preceded by an equal sign (e.g., “=AVERAGE”).
Can I apply multiple formatting rules to the Total Row?
- Yes, you can apply multiple formatting rules to different cells within the Total Row to make it more informative and visually appealing.
Conclusion
Excel’s Total Row feature is a valuable tool for simplifying data analysis and saving time. By following the steps and tips outlined in this guide, you can harness the full potential of the Total Row feature and efficiently work with large data sets in Excel.