
Managing data in Excel can be a powerful tool, allowing you to work with vast datasets. However, presenting this data in an understandable way is equally important. One effective way to achieve this is by creating charts. Charts and graphs not only make your data visually appealing but also convey information efficiently. In this blog post, we will explore how to add a title to an Excel chart, step-by-step, like a pro.
Why Adding a Title to an Excel Chart Matters
A title is a crucial element of any chart. It provides context, helping the viewer understand what the chart represents. Whether you’re creating a bar chart, pie chart, or any other type of graph in Excel, adding a title is essential for clarity. Now, let’s dive into the step-by-step process to add a title to your Excel chart.
Step 1: Select Your Chart
To add a title, first, click on the chart where you want to insert the title. This will activate the Chart Tools tab at the top of your Excel window. The Chart Tools tab consists of two sub-tabs: Format and Design.
Step 2: Access the Design Tab
Click on the Design tab. This is where you will find options for customizing your chart’s appearance and layout.
Step 3: Choose a Chart Layout
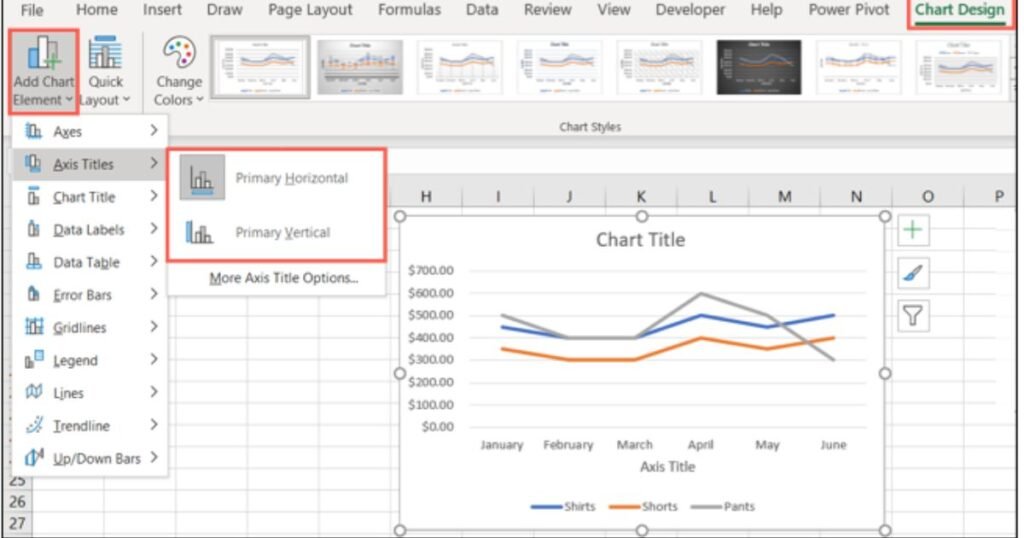
Under the Design tab, locate the “Chart Layouts” group, and click on “Add Chart Element.”
Step 4: Select “Chart Title”
From the dropdown menu that appears, choose “Chart Title.” You’ll be presented with options for where you want to place your title.
Step 5: Position Your Chart Title
You can choose to place your chart title above the chart (Centered Overlay), to the left, right, or above the chart area. Select the placement that suits your chart the best. The “Centered Overlay” option positions the title above the chart, creating a clean and professional look.
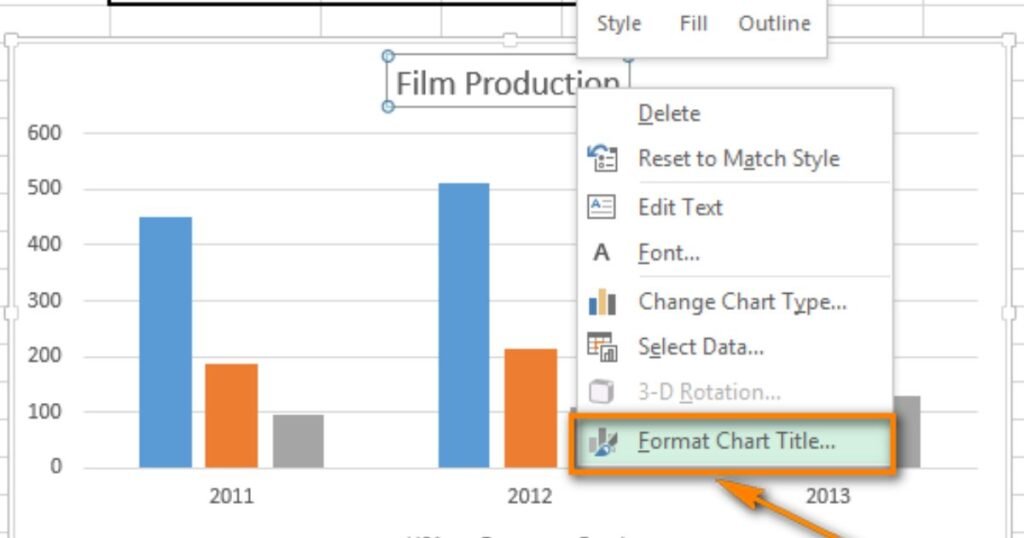
Step 6: Customize Your Chart Title
After selecting the title’s position, click on the title box, which will highlight the text, allowing you to edit it. This is where you can add the specific name or description you want to appear as the title of your chart.
Step 7: Combine Text and Cell Linking (Optional)
If you wish to include additional text in your chart title, you can use a formula to combine a cell link with the title text. This is a great way to add dynamic information to your chart title, such as a year-over-year (YoY) indicator.
Here’s a simple example of how to achieve this:
- In a new cell, enter the formula: =A1&”(YoY)”. This formula combines the contents of cell A1 with the text “(YoY).”
- Click on the chart title box to activate the formula bar.
- Add an equal sign (=) and then select the cell where you’ve entered your formula.
- Press the Enter key.
This will link your chart title to the contents of cell A1, and it will automatically update as the content of cell A1 changes.
Adding Depth to Your Chart Title
Now that you’ve learned how to add a title to your Excel chart, let’s explore some ways to make your chart title even more informative and visually appealing.
Enhance with Visual Elements
Consider using fonts, colors, and formatting options to make your chart title visually engaging. You can use bold or italicized text, larger fonts, and various text colors to draw attention to the title.
Include Descriptive Subtitles
If your chart is complex or contains multiple data series, including a descriptive subtitle beneath the main title can provide additional context. For instance, if your chart displays revenue data for multiple years, the subtitle could specify which year the chart represents.
Also Read:
How to Square a Number in Excel
How To Omit The First Line In Excel Cell?
FAQs
Why should I add a title to my Excel chart?
Adding a title provides context and helps viewers understand the chart’s purpose, making your data more accessible and meaningful.
What is the purpose of a subtitle in a chart title?
A subtitle can be used to provide additional information or context, such as specifying the time period or data series represented in the chart.
Can I use SEO keywords in my chart title?
Yes, incorporating relevant keywords in your chart title can improve its search engine discoverability, especially if you’re using the chart online.
How do I link a chart title to a cell for dynamic updates?
To link a chart title to a cell, enter a formula that combines cell content with text (e.g., =A1&”(YoY)”), select the title, add an equal sign and link it to the cell containing the formula.
Conclusion:
Adding a title to your Excel chart is a simple yet essential step to make your data more understandable and meaningful. By following the step-by-step process and considering the additional tips and tricks, you can create informative and visually appealing chart titles that enhance your data presentation. Whether you’re creating charts for a business report, a presentation, or an online publication, a well-crafted chart title will make a significant difference in conveying your data effectively. So, why wait? Start adding titles to your Excel charts.